

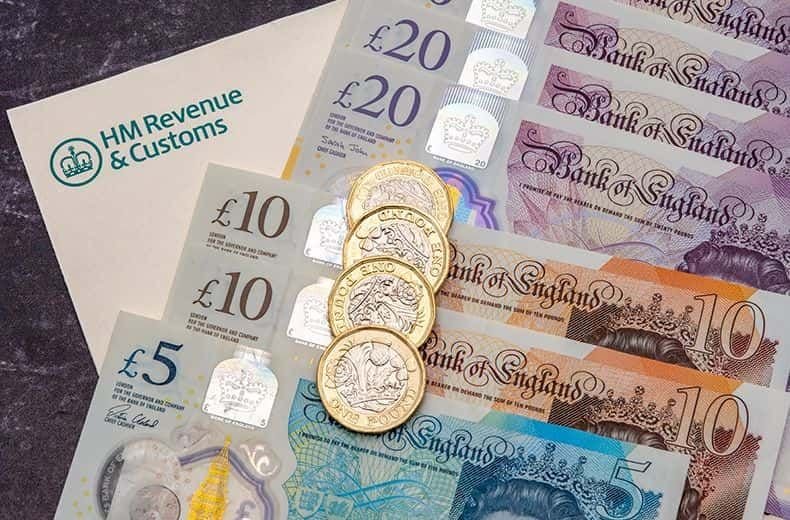
Every adult in Britain is, on average, poorer than they were five years ago, and by a margin that has few parallels among wealthy nations. According to the UBS Global Wealth Report 2026, average wealth per adult in the UK fell by 23.2% between 2020 and 2025, the steepest decline of any of the 37 developed economies the bank surveyed. Median wealth fell by a similar amount, leaving the typical British adult holding around £95,500 in net assets, a little ahead of the French but behind both the Dutch and the Italians. To put the scale of this in context, households in Turkey, Bulgaria, Mexico and Kazakhstan all fared better over the same period.
Inflation, energy, housing stopped doing the one thing households had always relied on it to do. But also, buried inside that macroeconomic story is a smaller and more useful one, about which parts of this outcome were genuinely beyond anyone’s control, and which parts were shaped by decisions that individual households actually made.
What actually happened
To understand why UK wealth fell so much further than wealth in comparable economies, it helps to start with inflation, because inflation is the mechanism that did most of the damage. UBS’s chief economist, Paul Donovan, pointed to a period in which Britain experienced notably higher inflation than the rest of Europe, driven in large part by quirks in how the UK prices energy. That period is not abstract. UK inflation reached 11.1% in October 2022, a 41-year high, as energy costs spiked following Russia’s invasion of Ukraine and the mini-budget under Liz Truss rattled financial markets further. High inflation erodes wealth in a very direct way. It reduces the real purchasing power of whatever money a household holds, whether that money sits in a current account, a savings account, or is tied up in the value of other assets that don’t keep pace with rising prices. When inflation runs at over 11%, a household needs its assets to grow by more than 11% in the same period just to stand still in real terms. Very few UK household assets managed that.
The scale of the UK’s underperformance becomes clearer once you look at what happened elsewhere. South Korea’s average wealth per adult rose by 55% over the same five years. Japan’s median wealth climbed 51%, the strongest performance among G7 economies. Even Russia, despite more than four years of Western sanctions, saw average wealth per adult grow by 36.9% in real terms. These aren’t small differences, and they demonstrate that a global inflation shock following the pandemic did not have to produce a wealth collapse of this size.
Britain’s outcome reflects specific domestic conditions, including its particular exposure to energy price volatility and a housing market that, as the next section shows, failed to protect the wealth people thought it was protecting. None of this was something an individual household could have changed through smarter budgeting or better financial planning. Energy policy, exchange rates and the inflationary aftershocks of a global pandemic sit well above the level at which personal choices operate.
The housing paradox
If there is one number in this story that should unsettle anyone who assumes property is a safe store of value, it is this: UK house prices rose by 26% between early 2020 and 2025, according to the Office for National Statistics, while consumer prices rose by 32% over the same period. On paper, most homeowners watched the price of their home go up. In practice, because the cost of everything else rose faster, the real value of that asset fell. A house that was nominally worth more in 2025 than in 2020 could still represent less purchasing power than it did five years earlier, once you account for what that money could actually buy. Donovan made a version of this point directly, noting that real estate carries enormous weight in household wealth calculations because it is the largest asset most people own, and that changes in how local property markets perform relative to inflation can move the entire national wealth figure.
This matters more in Britain than in many comparable countries precisely because British households are so heavily concentrated in property as a form of wealth, relative to shares, pensions or other financial assets. A household whose net worth is overwhelmingly tied up in one house, in one local market, is fully exposed to whatever happens to that specific market relative to inflation nationally. If prices in that market underperform inflation, as they did on average across the UK during this period, there is no offsetting gain elsewhere in the portfolio to soften the blow.
This is where the story starts to shift from something purely structural toward something households had at least partial influence over. Nobody could have controlled the national gap between house price growth and inflation. But the degree to which a household’s entire net worth depended on that single gap, rather than being spread across other kinds of assets, was closer to a choice, even if it rarely felt like one at the time. Most people don’t consciously decide to put all their wealth into their home; it simply happens, because a mortgage is the largest financial commitment most households ever make and buying a second asset class alongside it can feel like a luxury. Still, the pattern is worth naming, because it is the clearest illustration in this entire report of the difference between a shock nobody could see coming and a level of exposure to that shock that varied from household to household.
The levers you did have
Three areas stand out as places where households genuinely had room to influence how much of this shock they absorbed, even though none of them could have prevented the shock itself.
The first is what happened to cash sitting in savings accounts. Research from the comparison site Finder found that the average UK savings account lost £2,989 in real terms between June 2020 and June 2025, and that inflation exceeded the average variable cash ISA rate in 51 of the 60 months across that period, or 85% of the time. Banks were slow to pass on the Bank of England’s rate rises to savers even as they raised the cost of borrowing quickly, according to the Financial Conduct Authority’s 2023 review of the cash savings market, which found that the UK’s largest banks passed on only around 28% of a 4.25 percentage point rise in the base rate to easy-access savers between January 2022 and May 2023. A household that left a significant sum sitting in an easy-access account earning close to nothing while inflation ran into double digits experienced a direct, quantifiable loss of real wealth. A household that moved the same sum into a fixed-rate ISA when rates peaked, or otherwise shopped around, kept meaningfully more of its value intact. That gap was not available to everyone, since building up spare cash in the first place requires disposable income that a quarter of UK adults, holding £200 or less in savings, simply don’t have. But for those with a cash buffer, where that cash sat was one of the more controllable variables in this entire period.
The second lever is the structure of household debt, particularly mortgage debt, through the rate-hiking cycle that ran from December 2021 to August 2023, during which the Bank of England raised the base rate 14 times in succession. Homeowners who had locked into long fixed-rate deals before this cycle began were largely insulated for the length of that fix. Homeowners on variable rates, or those whose fixed deals expired partway through the cycle, faced a different reality entirely.
The Bank of England’s own analysis found that mortgage holders refinancing in 2023 faced monthly repayment increases averaging around £250, and separate analysis from the Institute for Fiscal Studies estimated that rising mortgage rates pushed roughly 320,000 people into poverty by the end of that year, with borrowers who remortgaged in 2022 two percentage points more likely to fall behind on other bills than those who hadn’t. Nobody chose the timing of a global rate-hiking cycle. But the length and type of mortgage a household held going into it, a decision often made years earlier for reasons that had nothing to do with anticipating an inflation shock, ended up determining how much of that shock landed on their monthly budget.
The third lever connects directly back to the housing paradox above: how concentrated a household’s wealth was in a single asset class. Households that held savings, pensions or investments alongside their property had other places for value to sit while the housing-to-inflation gap widened. Households with almost everything tied up in one home did not. This is less a specific action any one household took and more a background condition that shaped how exposed they were to everything else in this article, but it belongs alongside the other two because it is the clearest expression of the difference between what happened to Britain and what happened, specifically, to any given household within it.
Where this leaves you
Most of what shrank British wealth over the past five years was decided in energy markets, in inflation data, and in decisions made at the Bank of England and the Treasury, not around individual kitchen tables. That is a genuinely uncomfortable thing to sit with, because it means no amount of careful budgeting was ever going to reverse a national wealth decline of this size. But it is not a reason to disengage from the question entirely. It is a reason to focus attention on the smaller set of decisions that were actually within reach: where spare cash sat while inflation ran hot, how a mortgage was structured going into a rate-hiking cycle, and how much of a household’s net worth depended on a single asset performing well. What happens to any individual household over the next five years will depend, in part, on which of these levers they choose to use.
💼 Unpacked
Real vs nominal wealth — Nominal value is the price tag attached to an asset at any given moment. Real value adjusts that price for inflation, showing what the asset can actually buy. A house can rise in nominal value while falling in real value if prices generally are rising even faster, which is exactly what happened across the UK housing market between 2020 and 2025.
Wealth concentration — The degree to which a household’s total net worth sits in one type of asset, such as property, rather than being spread across several, including savings, pensions and investments. High concentration means a household’s overall financial position rises and falls almost entirely with the fortunes of that one asset class.
Base rate — The interest rate the Bank of England charges commercial banks, which in turn shapes the rates those banks offer to savers and charge to borrowers. The Bank raises the base rate to cool inflation by making borrowing more expensive and saving more attractive, and lowers it to encourage spending when the economy needs a boost.
Asset allocation — The way a household or investor divides its wealth across different categories of asset, such as cash, property, shares and pensions. Allocation decisions determine how exposed a portfolio is to any single market moving in an unfavourable direction, and they sit near the centre of most of the “levers” discussed in this piece.
📣 Support The Fiscal Compass
If you found this insightful, consider sharing with friends or colleagues. For weekly economics-led takes on markets, policy, and macro trends, subscribe to The Fiscal Compass.
Follow along on social media for concise updates throughout the week:
Instagram: @thefiscalcompassofficial
X: @FiscalCompass.
LinkedIn: Vinay Meisuria
Sources
- UBS, Global Wealth Report 2026 — referenced via: Britain suffers biggest fall in wealth in the rich world since the pandemic, LBC
- UK household wealth posts biggest decline among rich nations since 2020 – UBS, RT
- Economy alert: UK households hit with biggest wealth decline in the rich world due to inflation, GB News
- UK Wealth Slump: Britain Suffers Rich World’s Biggest Fall Since Covid, Business Matters
- Office for National Statistics, UK House Price Index — referenced via: How increases in housing costs impact households, ONS
- What is the average savings interest rate in the UK?, Finder
- Financial Conduct Authority, Cash Savings Market Review 2023 — fca.org.uk
- Bank of England, Interest rates and Bank Rate: our latest decision — bankofengland.co.uk
- Bank Underground, Mortgage affordability for borrowers who re-fixed in 2023 — bankunderground.co.uk
- Institute for Fiscal Studies, 320,000 people pushed into poverty because of mortgage interest rate rises — ifs.org.uk
- HomeOwners Alliance, Mortgage Rate Predictions 2026 — hoa.org.uk
Featured Image: Great British Pounds, Hire2You